Volume Profile & Jigsaw Daytradr: The Only Indicators Serious Traders Need
In a world of trading indicators that promise to “predict” the market, it’s easy to drown in signals that confuse more than they clarify. I’ve been through that rabbit hole—RSIs, MACDs, EMAs—you name it. What changed the game for me wasn’t more indicators. It was better context.
Today, I rely almost exclusively on two tools: the Volume Profile and Jigsaw Daytradr. No fluff. No lagging lines. Just real-time, actionable information directly from the market.
Why I Don’t Use Traditional Indicators Anymore
Many retail traders use traditional indicators because they’re easy to find and look good on a chart. But most of them are based on past price, not what’s happening now. In fast markets, lagging tools can cost you entries, exits, or worse—false confidence.
That’s why I moved to tools that help me see what really matters: who is trading, where they’re trading, and how much they’re trading.
Volume Profile: A Map of Market Intent
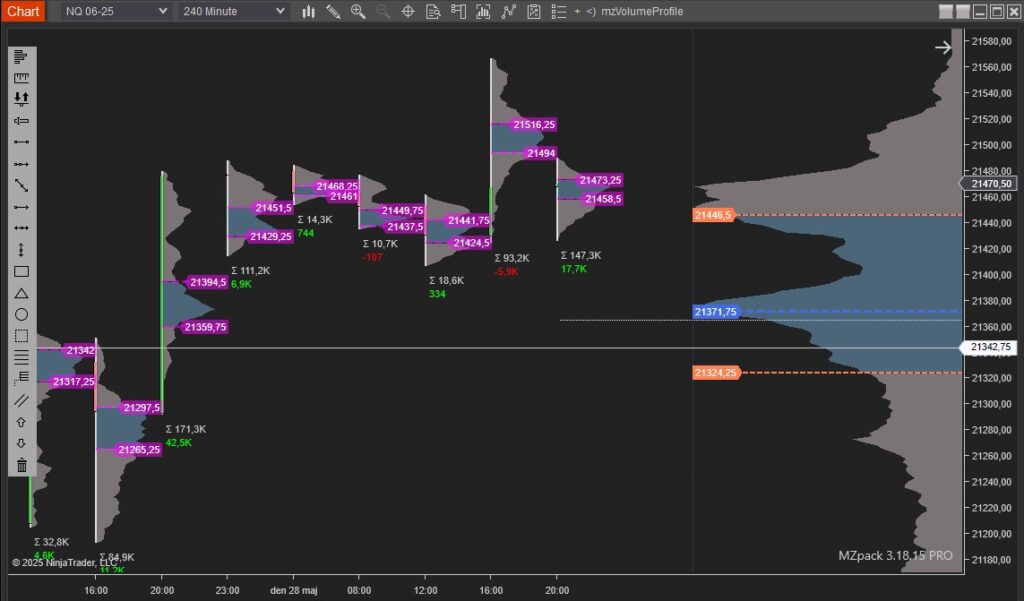
The Volume Profile shows me where the most activity occurs at each price level. Unlike candlestick charts that show time-based volume, the Volume Profile stacks volume horizontally—so I can see the prices that actually matter.
How I Use It
- High Volume Nodes (HVNs): Areas where the market has spent time and traded heavily. Often act as support/resistance.
- Low Volume Nodes (LVNs): Zones where price moves quickly through. Good for breakout setups.
- Point of Control (POC): The price with the most traded volume — the session’s “center of gravity.”
Volume Profile tells me where the market wants to do business—not just where price has been.
Jigsaw Daytradr: The DOM That Shows True Market Behavior
Jigsaw Daytradr is my window into order flow—what’s really happening behind the candles. It’s not a tool for the faint of heart, but once you learn to read it, you’ll wonder how you ever traded without it.

What I Watch in Jigsaw:
- The Depth of Market (DOM): Monitor resting orders, absorption zones, and sudden liquidity shifts.
- Inside Print: See who’s hitting the bid or lifting the offer in real time.
- Reactions Around Key Levels: Combine with Volume Profile zones to anticipate and confirm setups.
Real-World Example:
Price approaches a Low Volume Node. Sellers appear stacked on the DOM, but they’re not getting follow-through. Then, buyers begin lifting the offer aggressively. That’s is often a signal to enter long—with confidence and tight risk.
Why I Trust These Tools
I’ve spent many hours watching these tools live in the futures market. I use Volume Profile for structure and Jigsaw Daytradr for timing. These aren’t “magic” indicators—they require skill, practice, and discipline. But they give you a real market insight, not false certainty.
I don’t trade based on guesses—I trade based on what other participants are doing. That’s the real edge. Momentum is the key here.
Final Thoughts: Simplicity with Precision
If your chart is cluttered with squiggly lines and you’re still unsure of your entries, it might be time to simplify. Tools like the Volume Profile and Jigsaw Daytradr don’t just show you data—they show you intent.
You don’t need 10 indicators on your chart. You need one clear view of what the market is trying to do—and that’s exactly what these tools provide. Build a strategy around what you see, DONT Use a System, follow your Plan/Strategy.